OLA Design Overview
Design Principles
Online Analytics (OLA) visualises data for users. A standard design approach achieves a consistent user![]() A person with the capability to log in to the CMP GUI software, such as a customer service advisor or agent. experience. Each business function has configured Key Performance Indictors (KPIs) that can be displayed to enable access to further self-serve analytics.
A person with the capability to log in to the CMP GUI software, such as a customer service advisor or agent. experience. Each business function has configured Key Performance Indictors (KPIs) that can be displayed to enable access to further self-serve analytics.
Accessing Online Analytics
OLA is web-based. You need an Internet connection to access the product.
Access is granted by a user licence issued by MDS, subject to a valid commercial agreement![]() In the Cloud Monetisation Platform, the entity that holds the instructions for generating the bills for one or more subscriptions. including the addresses and how often the bill is generated..
In the Cloud Monetisation Platform, the entity that holds the instructions for generating the bills for one or more subscriptions. including the addresses and how often the bill is generated..
Users access OLA via a web link or URL. Once accessed OLA displays a login screen.
A valid User Name and Password are required to access OLA.
Navigation
Toolbar
The OLA toolbar assists navigation, data selection, and collaboration.

OLA Toolbar
Breadcrumb Trail
The path to the current page is displayed at the top of the page. The current page is displayed in grey, the blue breadcrumb segments are live links to the named area.

Navigation Breadcrumb
Exporting Data
A number of charts and visualisations can Export to Excel or Export to CSV![]() Comma Separated Values. A simple file format used to store tabular data, such as a spreadsheet or database. CSV files can collect the data from tables so that it can be input to another table-oriented application such as a relational database application. to allow the displayed data to be downloaded for distribution to audiences without OLA access, or to save datasets with limited retention periods.
Comma Separated Values. A simple file format used to store tabular data, such as a spreadsheet or database. CSV files can collect the data from tables so that it can be input to another table-oriented application such as a relational database application. to allow the displayed data to be downloaded for distribution to audiences without OLA access, or to save datasets with limited retention periods.
Bookmarks
Bookmarks allow OLA users to save a configured data selection to allow quick access to a particular dataset that is commonly analysed. Bookmarks can be shared with other OLA users to mirror the same view of data.
Notes
Users can add notes to charts, graphs and other visualisations. User can also use the notes to share information about particular metrics, trends, KPIs, or other items. Notes are editable by any user. A snapshot of the data can be added to each note to provide a visual representation.
Real-time Collaboration
A user can invite other users to share an OLA session, enabling real-time collaboration. The same data can then be viewed by multiple users on multiple devices regardless of whether the invitees are licenced OLA users. Shared sessions enable interested parties to interact through OLA in real time by allowing viewing along with access to OLA functionally from their own device.
Home Page
The Home page is a high-level visual representation of the Business Functions configured in OLA. This starting point allows users to select which functional area to display for further information.
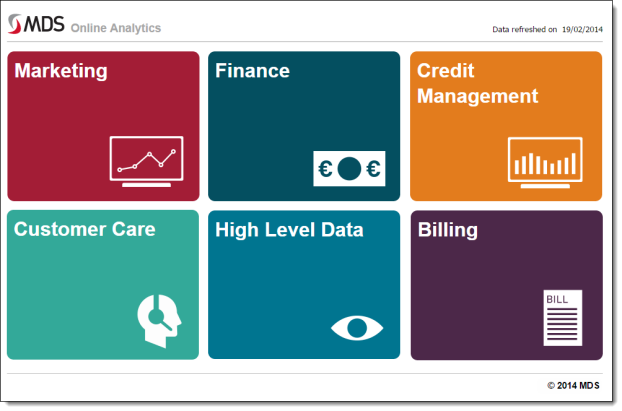
The Home Page
OLA applies colour coding to the data when it is displayed to highlight context-sensitive associated and non-associated data. Links to further information are displayed in white; out of scope data is shown in grey.
Pre-built filters in the reports enhance data analysis, allowing the user to use the links to make further data selections for deeper insight.